May 28, 2024
Menu engineering involves analyzing sales data and food costs to identify your most popular and profitable menu items. By strategically promoting these items, you can:
To get started with menu engineering:
ToolPurposePoint-of-Sale SystemTrack sales data and item popularityInventory TrackingMonitor food costs and profit marginsCustomer SurveysGather feedback on menu perceptionsMenu Design SoftwareCreate visually appealing, strategic menus
By implementing these menu engineering strategies, you can boost profits, streamline operations, and satisfy customers.
A point-of-sale (POS) system is essential for tracking sales data and understanding which menu items are popular or underperforming. Key features include:
Monitoring food costs and waste is crucial for determining menu item profitability and identifying cost-saving opportunities. An inventory tracking system should provide:
FeatureDescriptionReal-time cost visibilityTrack ingredient costs and usage.Automated inventory trackingMonitor inventory levels and reorder points.POS integrationAccurate sales and cost data.Reporting toolsAnalyze food costs, waste, and profitability.
While technology plays a key role, staff input and expertise are equally important for menu engineering:
1. Servers and bartenders
2. Chefs and kitchen staff
3. Managers and analysts
To improve your menu, you need to analyze how each item is doing. This involves finding out food costs and profit margins, tracking sales and popularity, and grouping items by profitability and popularity.
Knowing your food costs is key to understanding menu item profitability. To calculate food costs, you need to track the cost of each ingredient, including portion sizes and waste. Use your POS system to track sales data and inventory levels, which will help you calculate the food cost percentage. The food cost percentage is the ratio of food cost to menu price.
For example, if the food cost of a dish is $8 and the menu price is $20, the food cost percentage is 40%. This means that for every dollar sold, you spend 40 cents on food costs.
Contribution margin is another important number to calculate. It's the difference between the menu price and food cost. In the previous example, the contribution margin would be $12 ($20 - $8). This metric helps you identify which items make the most profit and which ones need improvement.
Tracking sales data is essential for understanding which menu items are popular and which ones need improvement. Use your POS system to track sales data, including the number of items sold, revenue, and peak selling times. This data will help you identify trends and patterns in customer behavior.
For example, if you notice that a particular dish sells well during lunch but not during dinner, you may want to adjust your menu or pricing strategy accordingly.
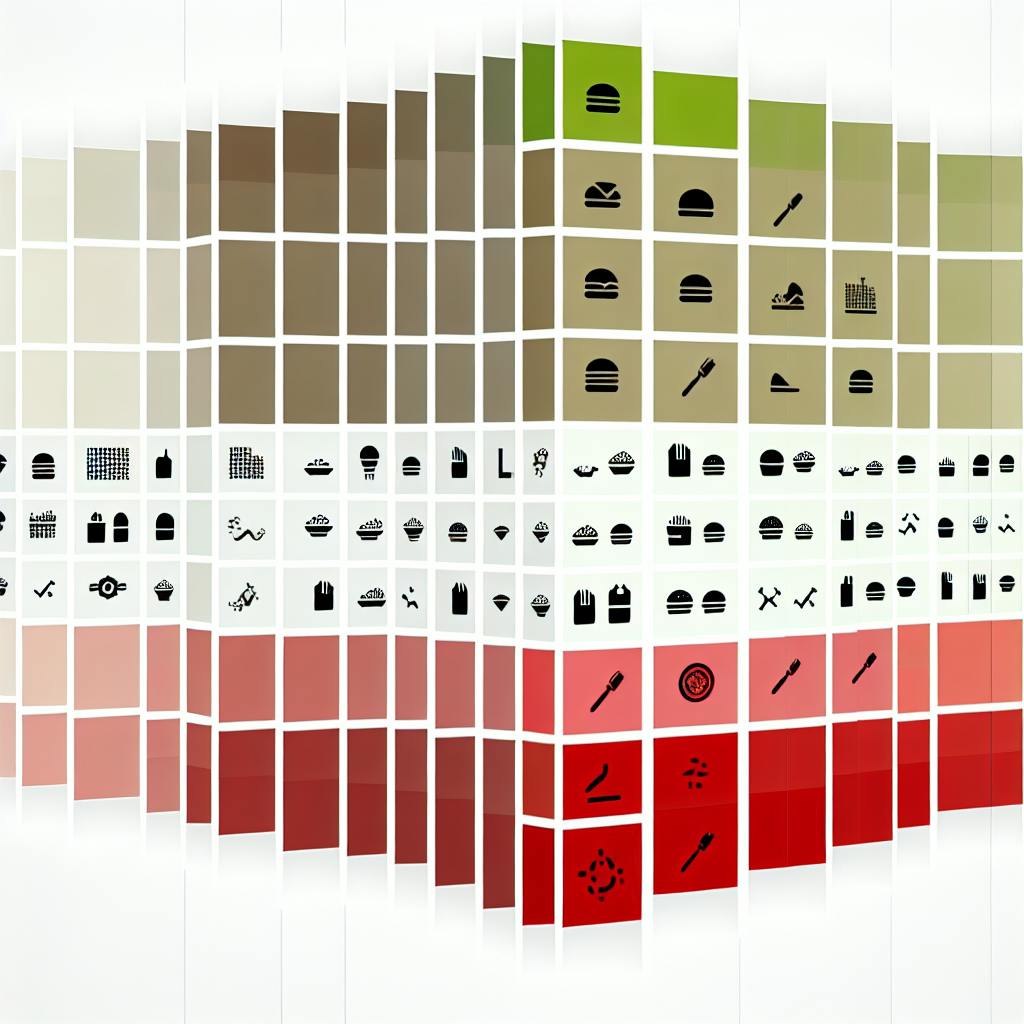
Once you have calculated food costs and margins and tracked sales data, you can group your menu items into four categories:
CategoryDescriptionStarsHigh-profit and high-popularity items that you should promote and highlight on your menu.PuzzlesHigh-profit but low-popularity items that you should try to increase demand for.PlowhorsesLow-profit but high-popularity items that you should consider raising the price or reducing the portion size.DogsLow-profit and low-popularity items that you should eliminate or replace with better options.
Knowing how much profit each menu item brings in is key. To do this, you need to calculate food costs and profit margins accurately.
Food costs include the cost of ingredients, labor, and overhead expenses. To find the food cost for a dish:
For example, if a dish costs $8 in ingredients and is priced at $20 on the menu, the food cost percentage is 40% ($8 / $20 = 0.4 or 40%).
The profit margin is the difference between the menu price and food cost. This shows how much profit each item makes.
In the example above, the profit margin is $12 ($20 menu price - $8 food cost).
Here's a table comparing profitability across different menu items:
Menu ItemFood CostMenu PriceProfit MarginFood Cost %Burger$3.50$10.00$6.5035%Salad$2.00$8.00$6.0025%Pizza$5.00$15.00$10.0033%Sandwich$4.00$12.00$8.0033%
This data helps identify:
Knowing these numbers lets you make smart decisions about pricing, portions, and menu changes.
Knowing which menu items are popular is key for menu engineering. By analyzing popularity, you can decide which items to promote, adjust pricing, and manage inventory better.
Item popularity refers to how well a menu item is selling. Common ways to measure popularity include:
These metrics show you what customers like and don't like, helping you spot trends.
Certain factors can affect how popular a menu item is:
Understanding how seasons and trends impact popularity can help you adjust your menu and inventory accordingly.
Here's an example table showing item popularity rankings:
Menu ItemSales VolumeOrder FrequencyCustomer RatingBurger5003004.5/5Salad3002004.2/5Pizza7004004.8/5Sandwich4002504.1/5
This table makes it easy to see which items are most popular and which ones need improvement.
Restaurants can boost profits by optimizing their menus. This involves analyzing item performance, categorizing items, and using design principles strategically.
Menu items fall into four groups based on profitability and popularity:
CategoryDescriptionStrategyStarsHigh profit, high salesHighlight these items, consider raising pricesPuzzlesHigh profit, low salesImprove descriptions, adjust pricing to increase salesPlowhorsesLow profit, high salesReduce food costs, adjust portion sizesDogsLow profit, low salesRemove or re-engineer these items
How items are presented on the menu impacts sales. Use these design principles:
PrincipleDescriptionItem placementPlace high-profit items at the top and bottom of sectionsVisual cuesUse bold text, images, and boxes to draw attention to high-profit itemsMenu sizeLimit the number of items to focus on high-profit options
Clear, appealing descriptions can boost sales of high-profit items:
StyleDescriptionAppetizingUse sensory language to describe the dishInformativeProvide details on ingredients, cooking methods, and nutritionEmotionalCreate a connection through storytelling or nostalgia
Regularly updating your menu is key to keeping it fresh and appealing to customers. Look at your sales data to see which items are top sellers, which ones aren't moving, and any seasonal trends. Use this info to:
Regular updates ensure your menu stays aligned with changing customer tastes and market trends.
Before making big menu changes, test them out first. Try new items, pricing strategies, and menu layouts to see how customers respond. Use methods like:
Testing helps validate changes and ensures they meet customer expectations.
Tracking tools make it easy to monitor your menu's performance. These tools give you real-time data on sales, customer feedback, and market trends, so you can make informed decisions about updates and changes. Popular tracking tools include:
ToolPurposePoint-of-Sale SystemsTrack sales dataInventory Management SoftwareMonitor stock levelsCustomer Feedback PlatformsGather customer reviews and ratings
With the right tools, you can continuously fine-tune your menu for maximum profitability and customer satisfaction.
In the competitive restaurant business, tracking menu item popularity and analyzing sales data is key to boosting profits and staying ahead of rivals. This guide has provided an overview of using these techniques, covering the tools needed, analyzing menu item performance, evaluating profitability, and strategies for optimizing menus.
By implementing the strategies outlined here, restaurants can:
Data-driven decision-making is crucial for success. Leveraging menu engineering techniques allows restaurants to stay flexible and responsive to changing customer preferences and market trends.
StrategyDescriptionTest ChangesUse A/B testing, surveys, and focus groups to validate menu updates.Track PerformanceLeverage tools like POS systems, inventory software, and customer feedback platforms to monitor menu performance.Stay FlexibleAdapt menus to changing customer tastes and market trends.
The easiest way to assess menu item popularity is to look at your sales data. Check your point-of-sale (POS) system, receipts, invoices, or inventory records to see how many of each item you sold over a given period. The items with the highest sales numbers are your most popular offerings.
You can also calculate metrics like Item/Cover % or Item/Check % to evaluate popularity:
MetricDescriptionItem/Cover %Measures how often an item is ordered per customerItem/Check %Measures how often an item is ordered per table or check
Analyzing these metrics can reveal customer preferences and buying patterns, helping you make informed menu decisions.
Enter your information in the form to receive a call from Loman and place an order like a customer would!
